Introduction
Welcome to the world of crypto trading! In this article, we will explore the powerful tool of technical analysis and its application in the cryptocurrency market.
As a trader, understanding technical analysis is crucial for making informed decisions based on market data and forecasting future price movements. This skill gives traders an edge in the volatile and fast-paced world of cryptocurrency trading.
In this section, we will cover the key concepts of technical analysis and how it can be applied to crypto trading. We will also explore some common technical indicators used in the cryptocurrency market, giving you a solid foundation to start incorporating technical analysis into your trading strategy.
If you are new to crypto trading, be sure to check out our article on Helpful Crypto Trading Methods for beginners. It offers valuable insights into various trading strategies that can complement your understanding of technical analysis.
So, let’s dive in and explore the world of technical analysis in crypto trading!
Understanding Technical Analysis
Technical analysis is a widely used method in the world of cryptocurrency trading. It is based on the premise that an asset’s price reflects all known information about the asset, making it a fair representation of its value. This approach relies on historical price data and trading volumes to discern patterns and trends that could indicate future price movements.
Historical Roots
The practice of technical analysis has deep roots, dating back to Charles Dow and his innovative Dow Theory. This theory laid the foundation for analyzing and predicting price movements in the stock market, which has since been adapted to various other financial markets, including the cryptocurrency market.
Information Interpretation
Key to technical analysis is the interpretation of historical price data. Traders use this information to identify trends, support and resistance levels, and potential entry and exit points for their trades. By analyzing past market behavior, traders aim to make informed predictions about future price movements.
Market Efficiency
One of the underlying assumptions of technical analysis is the idea of market efficiency, which suggests that all relevant information is already reflected in an asset’s price. This means that technical analysts believe it is unnecessary to consider any fundamental factors such as company earnings or economic indicators when making trading decisions.
Patterns and Trends
Technical analysts utilize a wide range of tools and techniques to identify patterns and trends in price movements. These may include chart patterns like head and shoulders, triangles, flags, and pennants, as well as trend lines, moving averages, and various technical indicators.
Future Price Movements
The ultimate goal of technical analysis is to forecast future price movements based on the identified patterns and trends. By understanding historical patterns, traders seek to capitalize on potential opportunities in the market.
In conclusion, technical analysis plays a crucial role in cryptocurrency trading by providing traders with valuable insights into market behavior. From its historical roots with Charles Dow to its application in modern cryptocurrency markets, technical analysis remains a popular approach for interpreting price data and making informed trading decisions.
For more insights into understanding market sentiments in crypto trading, check out our article on Evaluation of market crypto sentiments.
By incorporating these concepts into your trading strategy, you can gain a deeper understanding of how technical analysis can be applied in the exciting world of cryptocurrency trading.
Key Concepts of Technical Analysis
Technical analysis in the crypto market relies on several key concepts and tools to identify potential buying and selling points. Here are some of the key concepts to understand:
Charting Tools
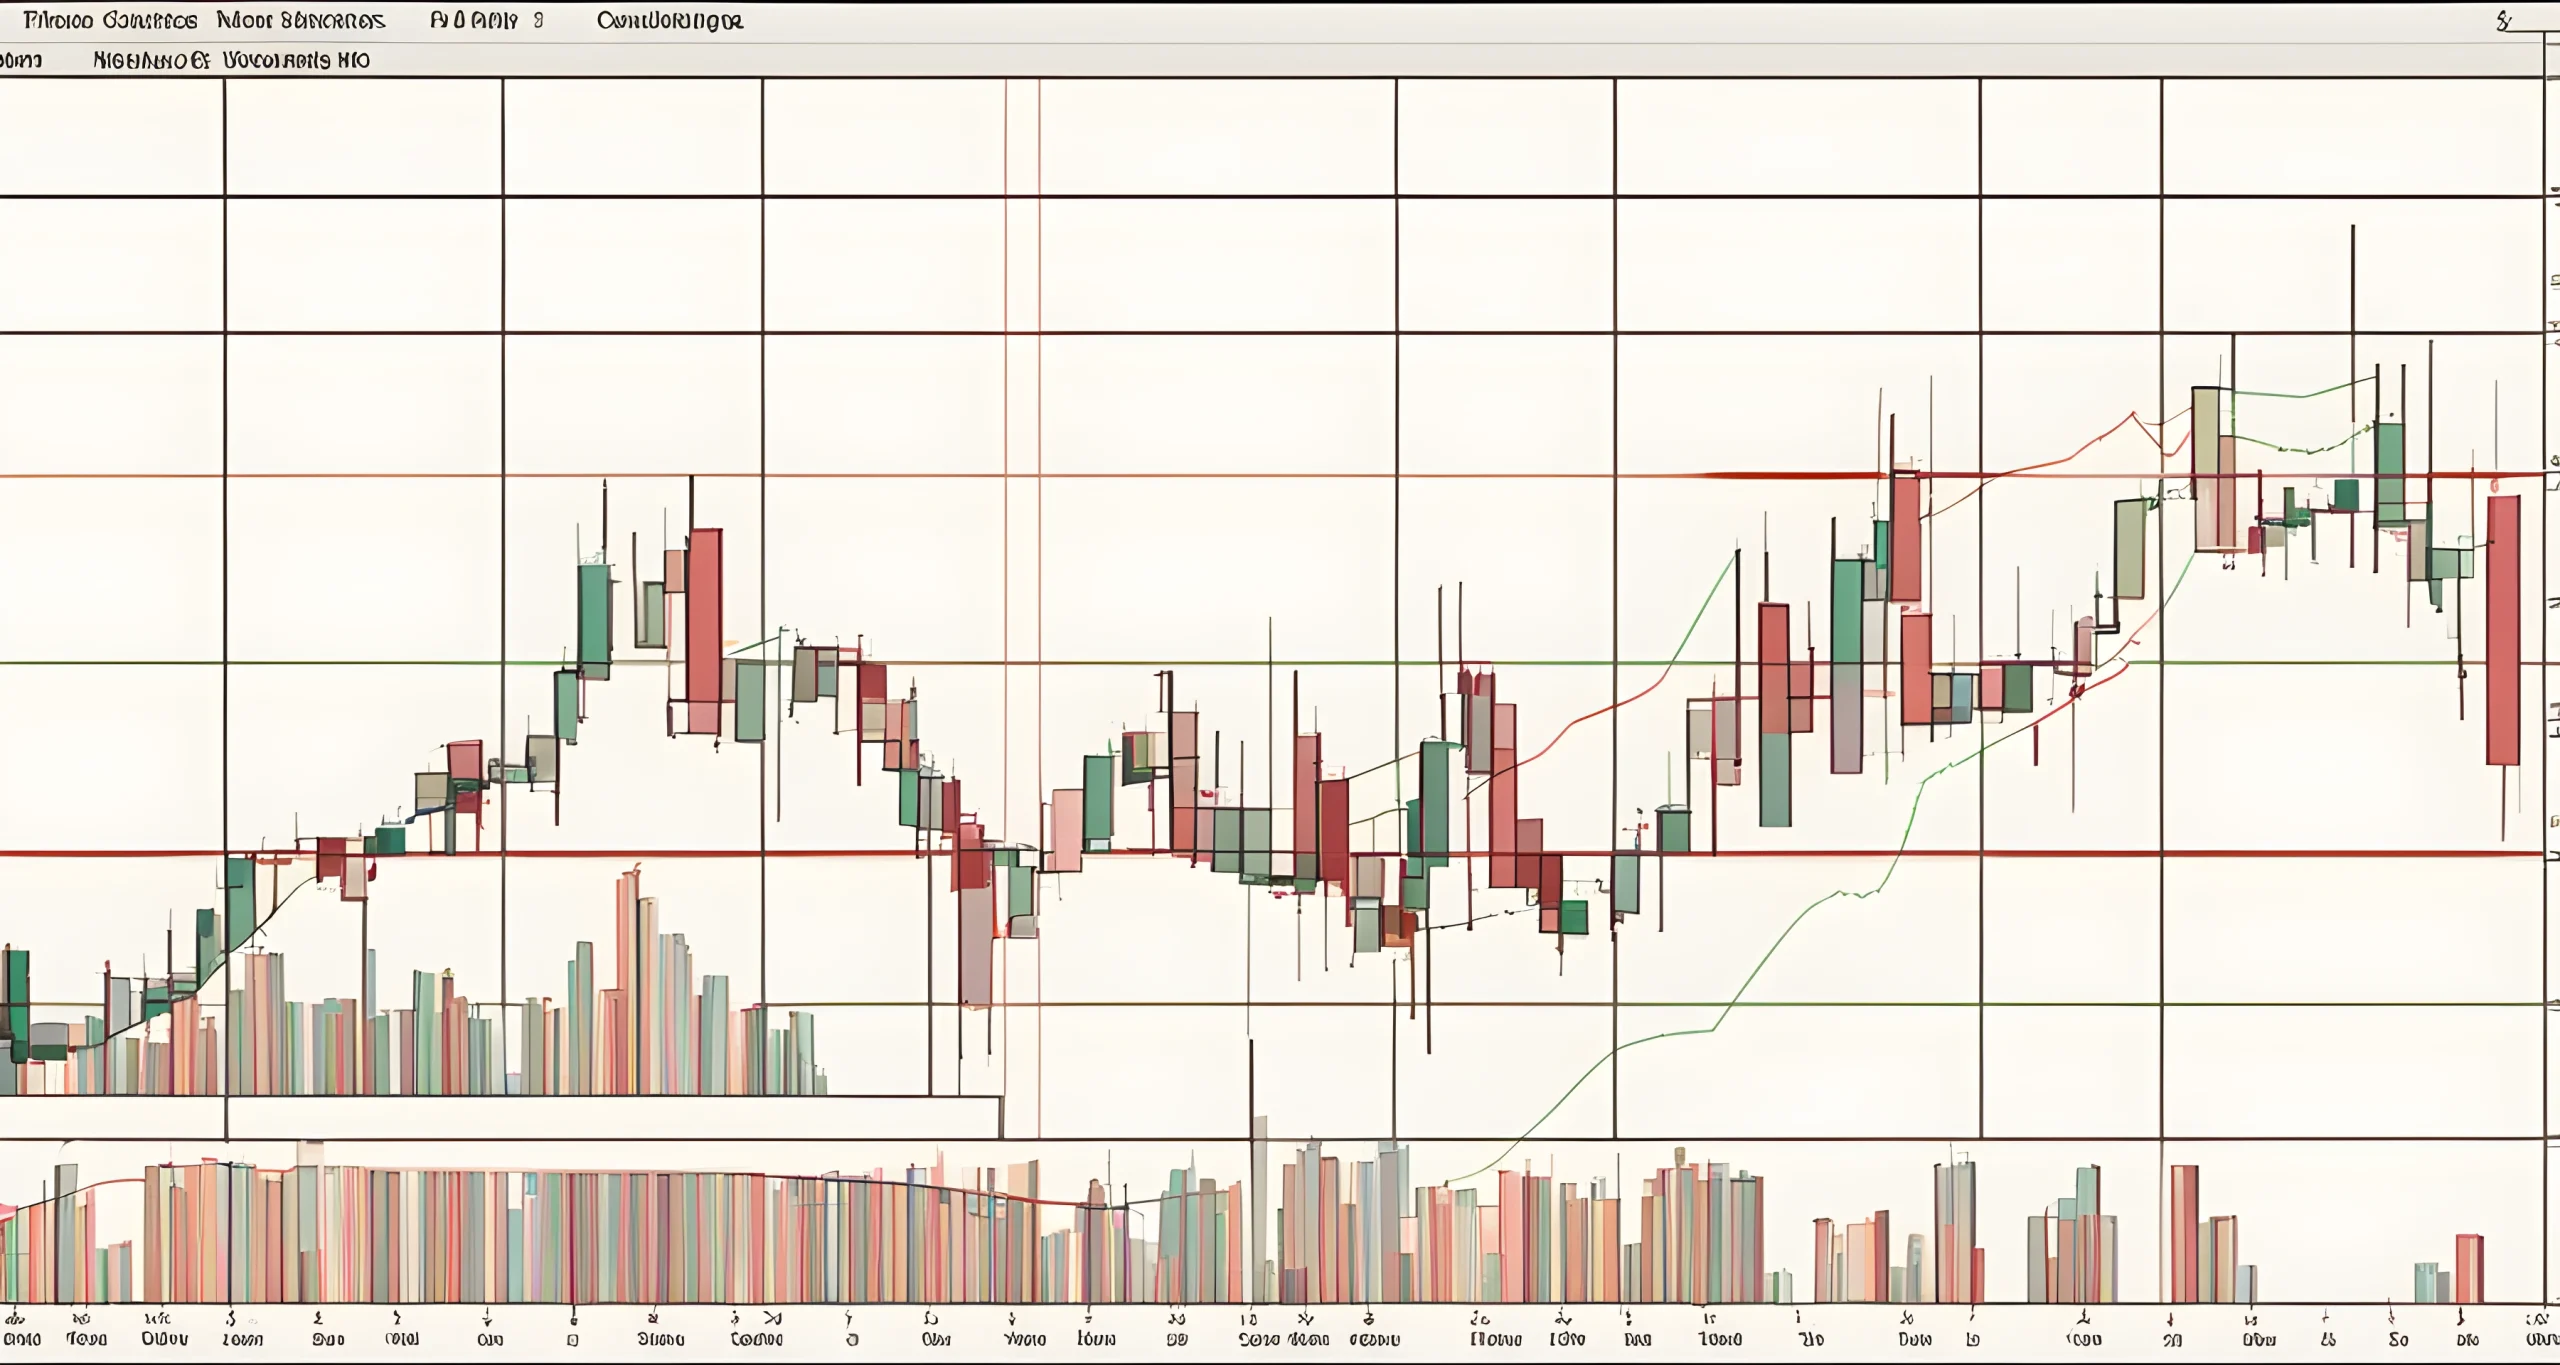
- Candlestick charts: These are popular tools for understanding market trends in the crypto market. Candlestick patterns can indicate potential price movements and help traders make informed decisions about when to buy or sell.
Support and Resistance Levels
- These levels indicate concentrated buying or selling interest in the market. Support levels act as a barrier that prevents the price from being pushed downward, while resistance levels prevent the price from being pushed upward. These levels make it challenging for prices to breach without significant market momentum.
Patterns
- Various chart patterns, such as head and shoulders, triangles, and flags, play a crucial role in technical analysis. These patterns can signal potential trend reversals or continuation and help traders anticipate future price movements.
Moving Averages
- Moving averages are used to smooth out price data and identify trends over a specific period of time. Traders often use moving averages to confirm trends and determine potential entry or exit points in the market.
Relative Strength Index (RSI)
- The RSI is a momentum oscillator that measures the speed and change of price movements. It is used to identify overbought or oversold conditions in the market, indicating potential reversal points.
Volume Analysis
- Volume plays a significant role in technical analysis as it provides insight into the strength of a price movement. High volume often indicates strong market participation, while low volume can signal weak interest in a particular asset.
By understanding these key concepts, traders can apply technical analysis effectively in their crypto trading strategies. These tools and concepts provide valuable insights into market trends, potential entry and exit points, and overall market sentiment.
For more in-depth analysis on predicting future crypto market trends, check out Bull Run Forecast Analysis for expert insights and forecasts on the next potential bull run in the crypto market.
By leveraging these key concepts of technical analysis, traders can make informed decisions and navigate the dynamic nature of the crypto market with confidence.
Applying Technical Analysis in Crypto Trading
When it comes to trading cryptocurrencies, technical analysis plays a crucial role in making informed decisions. By utilizing various tools and indicators, traders can analyze historical price data to identify potential market trends and make predictions about future price movements.
Importance of Moving Averages
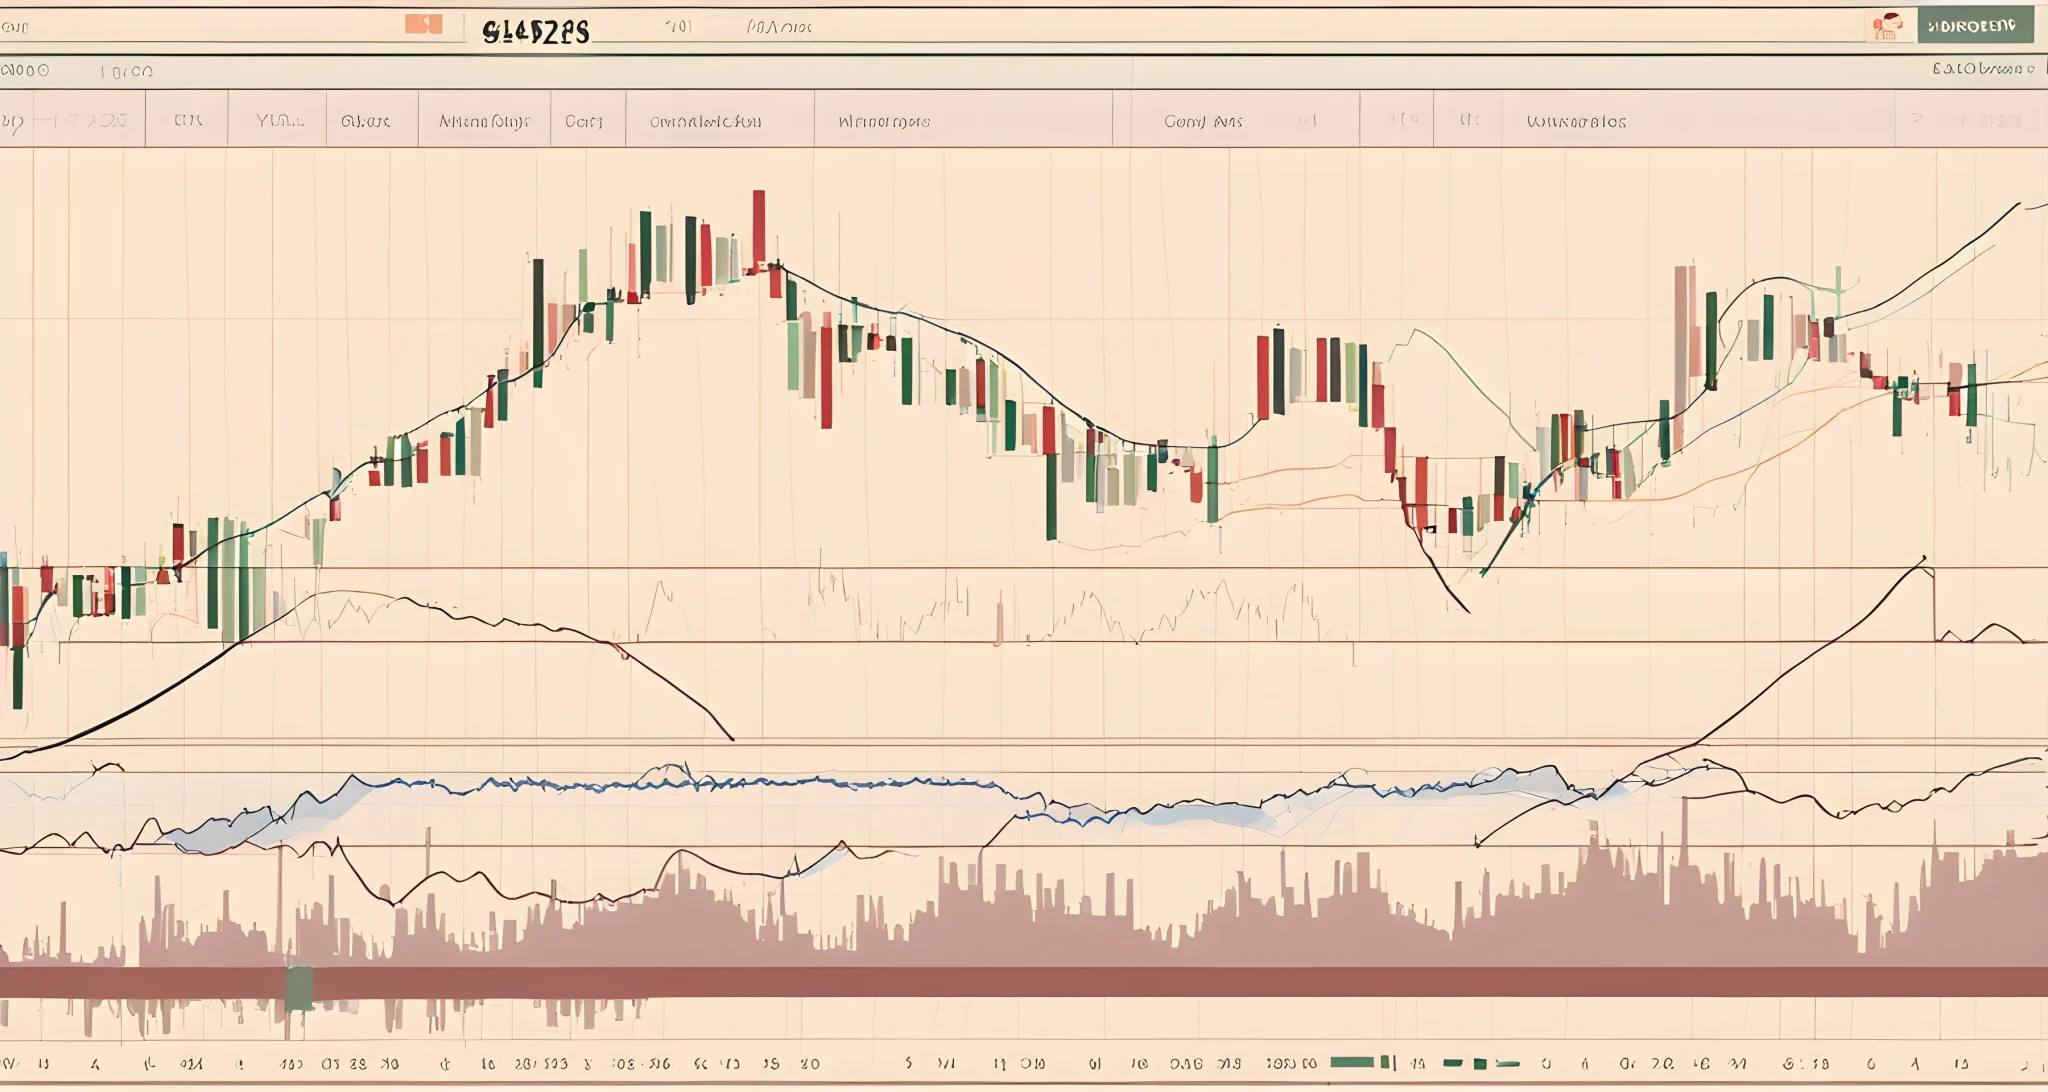
One of the key concepts in technical analysis is the use of moving averages. These are essential in smoothing out price fluctuations over time and highlighting underlying trends. The interaction between short-term and long-term moving averages is carefully observed by traders to gain insights into market trends and potential price movements.
Identifying Trends
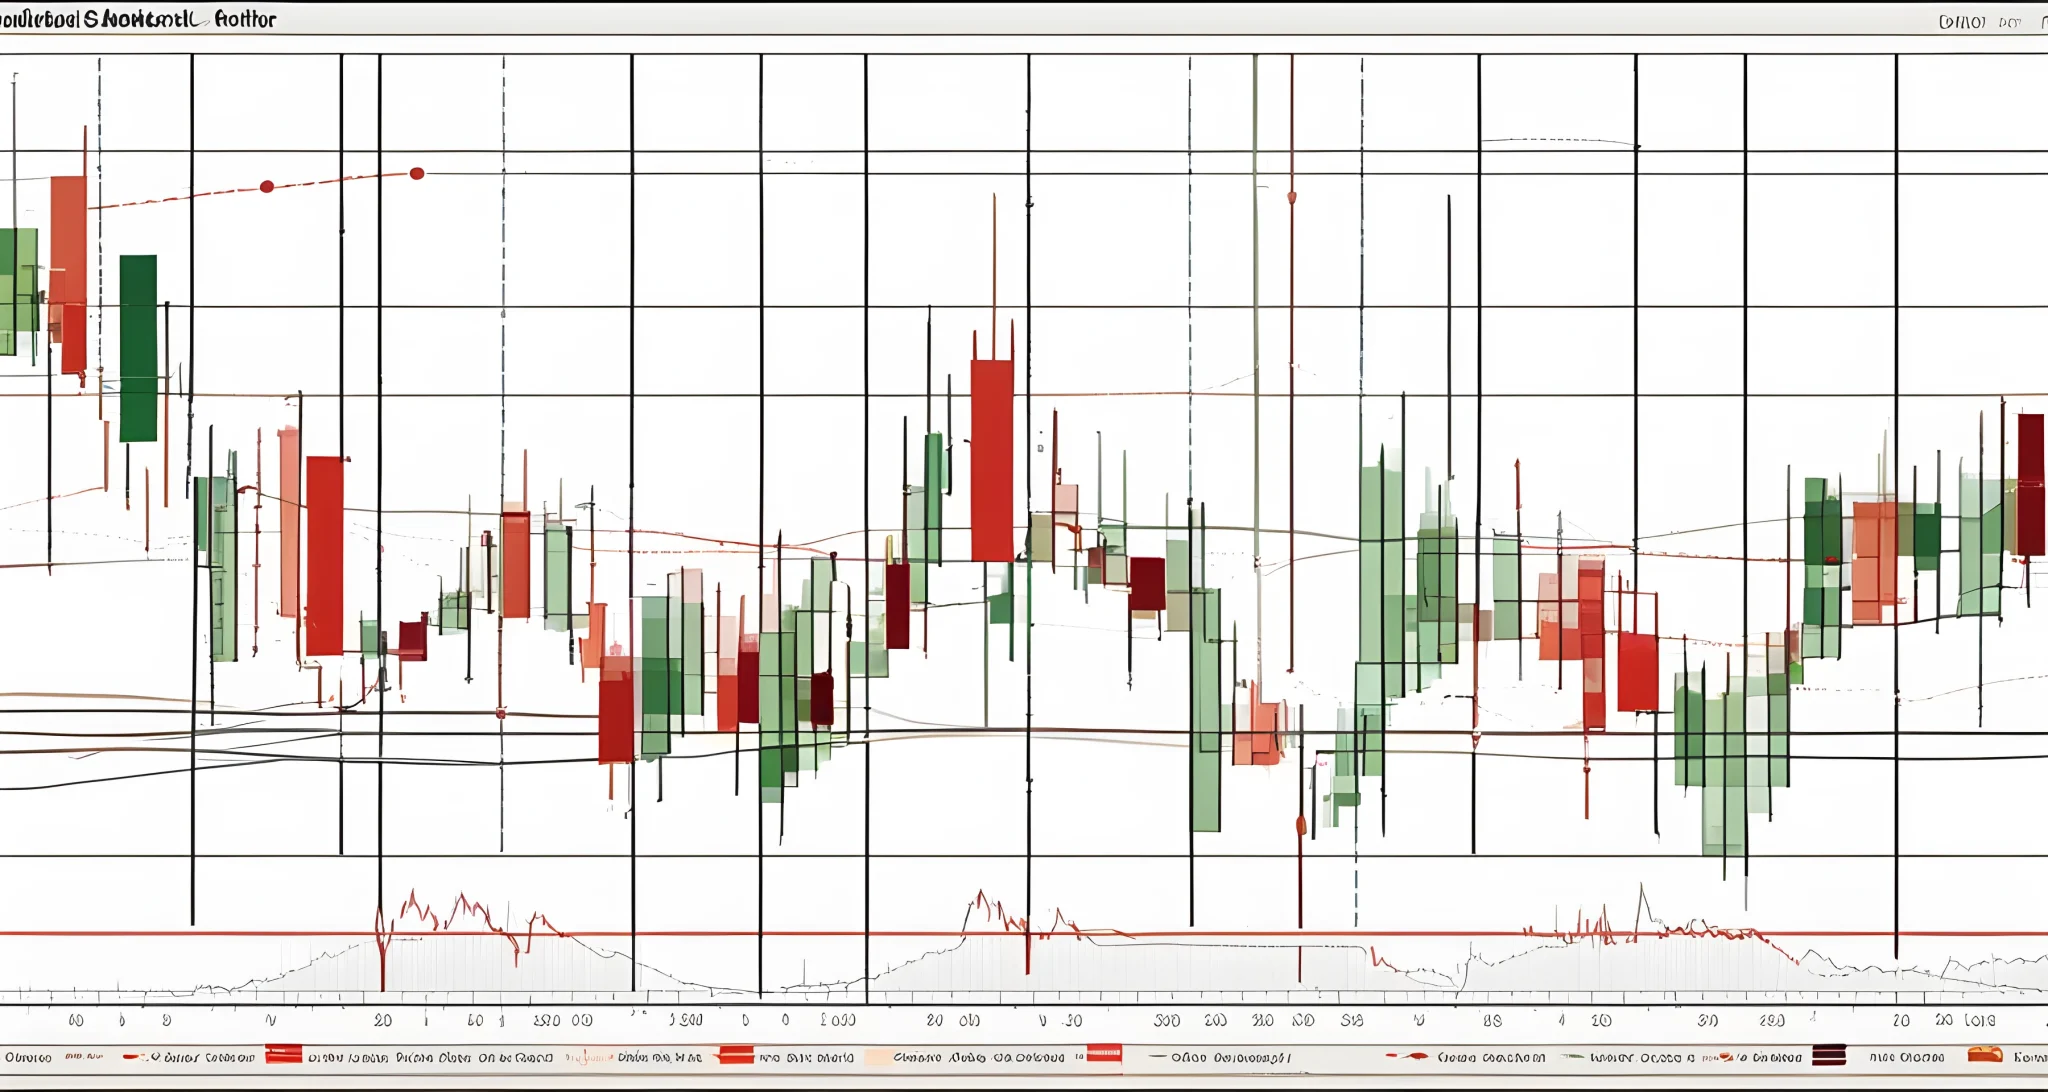
By using moving averages, traders can identify trends in the cryptocurrency market. The crossover of short-term moving averages above or below long-term moving averages can signal potential changes in the direction of the market trend. This information can be invaluable for making decisions on when to enter or exit trades.
Support and Resistance Levels
Moving averages also help in identifying support and resistance levels. These levels indicate price points at which a cryptocurrency may have difficulty breaking through, either on the upside or downside. Traders use this information to set entry and exit points for their trades, as well as to place stop-loss orders to manage risk.
Using Multiple Time Frames
Another important aspect of applying technical analysis in crypto trading is using multiple time frames for analysis. By analyzing price data on different time frames, traders can gain a more comprehensive understanding of market dynamics and make more informed trading decisions.
Combining with Other Indicators
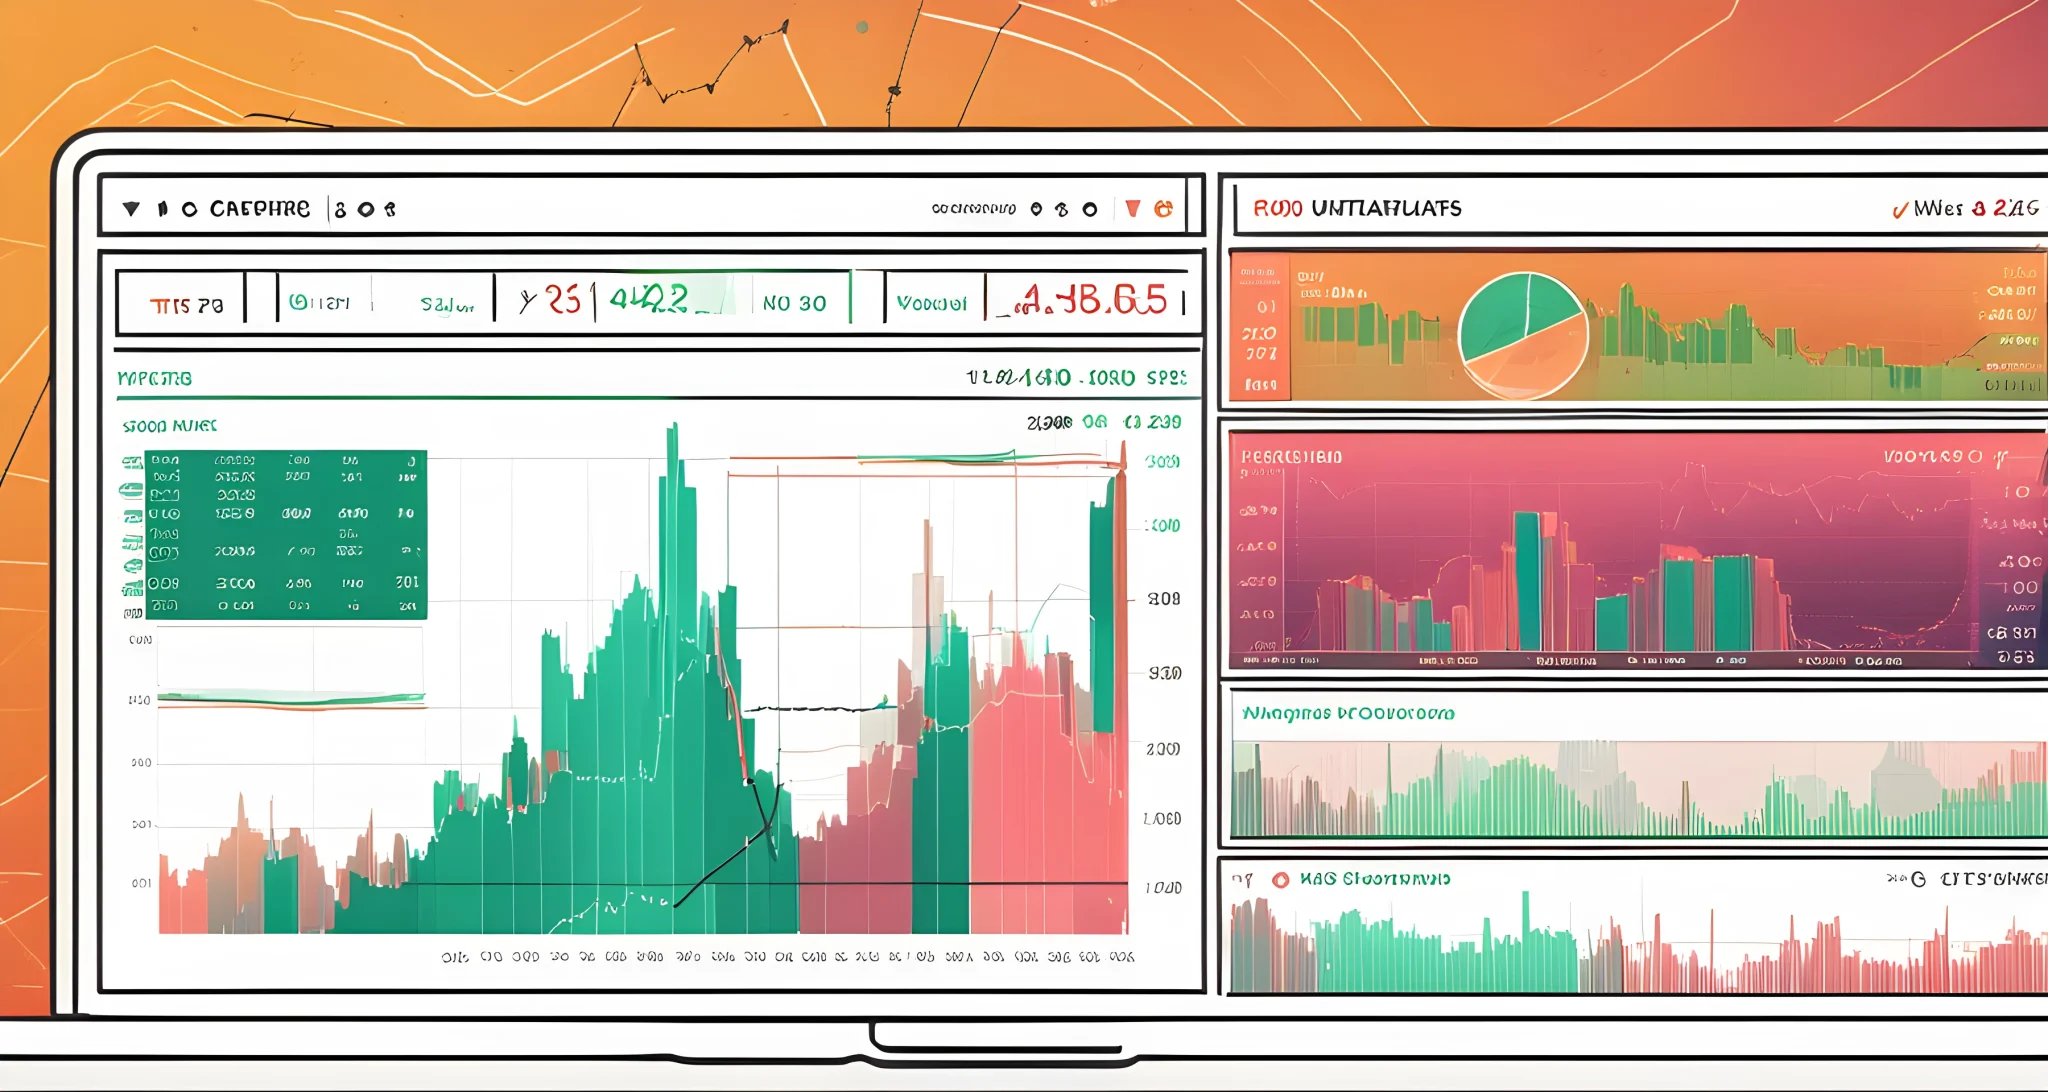
In addition to moving averages, traders often combine other technical indicators such as RSI (Relative Strength Index), MACD (Moving Average Convergence Divergence), and Bollinger Bands to further refine their analysis. These indicators provide additional insights into market momentum, volatility, and potential reversal points.
Conclusion
In conclusion, applying technical analysis in crypto trading involves using various tools and indicators to analyze historical price data and make informed decisions about potential market trends and price movements. Moving averages are essential in smoothing out price fluctuations over time and identifying trends, while other indicators provide additional insights into market dynamics. By combining these tools and indicators, traders can gain a better understanding of the cryptocurrency market and make more informed trading decisions.
In addition to technical analysis, it’s also important for traders to choose the right platform for executing their trades. Leading Crypto Trading Platforms offer advanced charting tools and a wide range of cryptocurrencies for trading, making them ideal choices for traders who rely on technical analysis for their strategies.
Common Technical Indicators in Crypto Trading
When it comes to applying technical analysis in crypto trading, there are several common technical indicators that traders often rely on to make informed decisions. These indicators help traders to analyze market data and trends, identify potential entry and exit points, and gauge market sentiment. Some of the most widely used technical indicators in crypto trading include:
-
Moving Averages: This indicator helps traders to smooth out price action by creating a constantly updated average price. By comparing different moving averages, traders can identify trends and potential reversal points.
-
Relative Strength Index (RSI): RSI is a momentum oscillator that measures the speed and change of price movements. It helps traders to identify overbought or oversold conditions in the market, which can be used as potential signals for buying or selling.
-
Bollinger Bands: By measuring volatility, Bollinger Bands help traders to identify potential buy or sell opportunities. The bands expand and contract based on market volatility, providing insight into potential price breakouts or pullbacks.
-
MACD (Moving Average Convergence Divergence): This indicator uses moving averages to identify changes in a trend’s strength, direction, momentum, and duration. It consists of two lines – a MACD line and a signal line – which can be used to generate buy or sell signals.
-
Fibonacci Retracement: Based on the Fibonacci sequence, this indicator is used to identify potential support and resistance levels. By drawing lines between significant price peaks and troughs, traders can identify potential reversal levels.
-
Volume Analysis: Analyzing trading volume can provide valuable insight into the strength of a trend or potential reversals. High volume can confirm a strong trend, while low volume may indicate a weakening trend.
By utilizing these common technical indicators, crypto traders can gain a better understanding of market dynamics and make more informed trading decisions. However, it’s important to note that no single indicator should be used in isolation. Instead, traders often combine multiple indicators to confirm signals and minimize the risk of false signals.
In addition to these technical indicators, it’s also crucial for traders to have a solid understanding of market cycles and analysis. Understanding market cycles can provide valuable insight into the broader market context in which these technical indicators are applied.
By integrating both technical analysis and an understanding of market cycles, crypto traders can develop a more comprehensive approach to their trading strategies, ultimately improving their chances of success in the dynamic crypto markets.
FAQ
What is technical analysis in crypto trading?
Technical analysis involves examining market data to forecast future price movements and make informed trading decisions in the cryptocurrency market.
What is the premise of technical analysis?
Technical analysis operates on the premise that all known information about an asset is reflected in its price, suggesting that the price is a fair representation of its value.
What charting tools are used in technical analysis?
Technical analysts rely on charting tools such as candlestick charts to visually represent price fluctuations and identify trends and reversals in the crypto market.
How do moving averages contribute to technical analysis?
Moving averages play a vital role in technical analysis by smoothing out price fluctuations over time and highlighting underlying trends, such as the interaction between short-term and long-term moving averages.